Real-estate developer in hot area sees bright future — and displacement
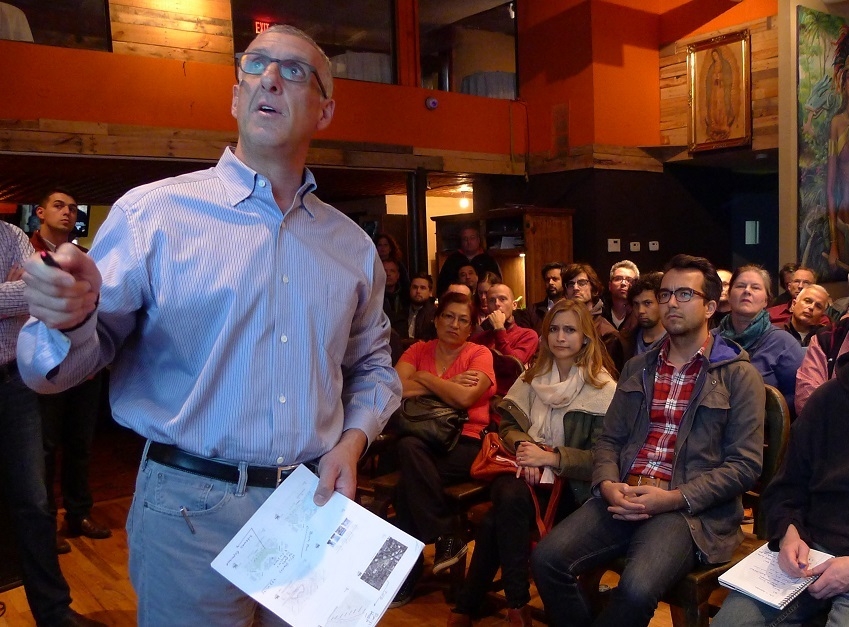
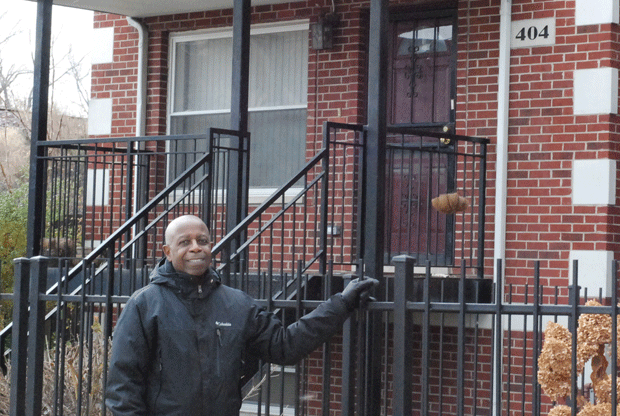
by Chip MitchellOn Chicago's Northwest Side, a developer behind a proposed upscale residential complex grapples with the working-class displacement his project will cause.
Dec. 15, 2014
A decade ago many Chicago neighborhoods were undergoing massive transformations. Condos were replacing old factories, new homes were springing up in abandoned railyards, the city was tearing down public housing to make way for mixed-income communities. Entire neighborhoods were turning around, while others were being targeted for speculation by investors trying to predict the next gentrification hot spots.
Then came the housing crash and the Great Recession. The gap between affluent and poor neighborhoods grew while the number of middle-class neighborhoods diminished. Now, as Chicago's economy claws its way back from the recession, many neighborhoods in the midst of recovery are improving but not technically gentrifying. By focusing our fears on that bogeyman are we ignoring the poverty and disinvestment that continues to plague other areas of the city?
In this series, WBEZ community-bureau reporters dig into the latest census and real-estate data in partnership with University of Illinois at Chicago's Voorhees Center to tell the story of Chicago's changing neighborhoods.
On Chicago's Northwest Side, a developer behind a proposed upscale residential complex grapples with the working-class displacement his project will cause.
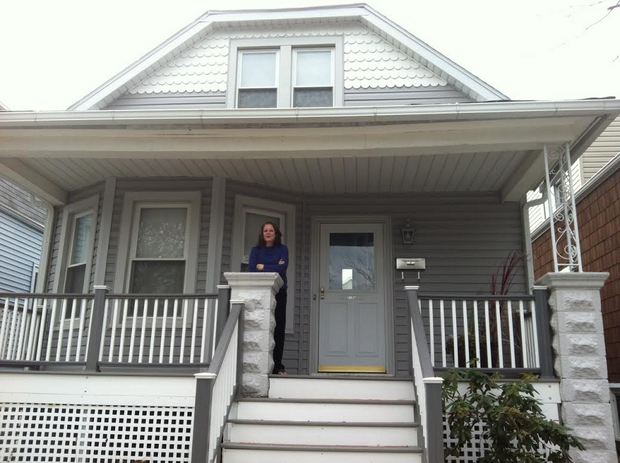
In Belmont Cragin some residents worry that a healthy recovery may lead to something more.
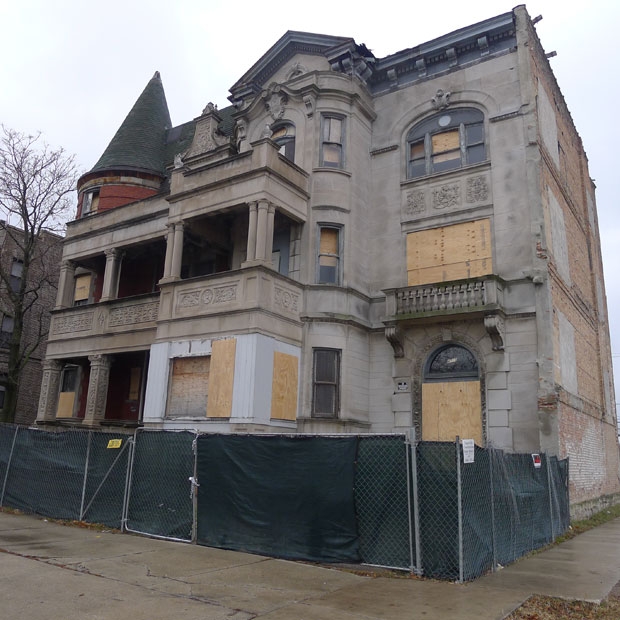
One expert points to longstanding poverty, lack of capital and retailers with an 'aversion to black consumers.'
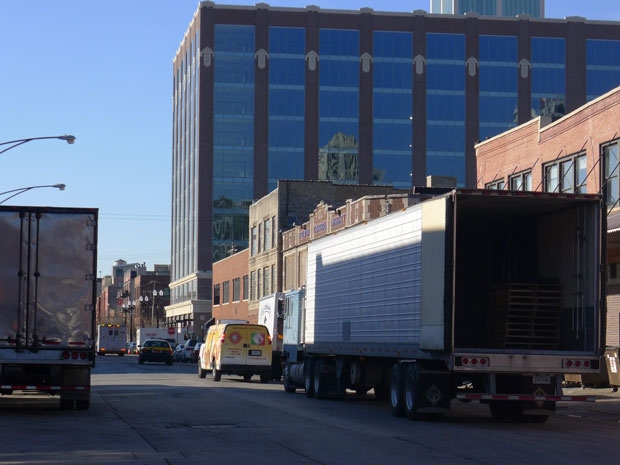
First it was Oprah, now Google. Former industrial zone is today an eclectic mix of meatpackers, celebrity chefs and high-end retailers.
As the housing market heats up in Chicago’s Albany Park neighborhood, one community group is looking for creative ways to curb the displacement of low-income residents.
To calculate its gentrification index, UIC researchers classified each Chicago community area by 13 socioeconomic factors. A point was added if the area was above the city average and subtracted if it was below. Change the map to see how areas compared in 2010 and how they've changed since 1970.
Use the table below to examine how Chicago community areas compared in 2010 in some of the key gentrification indicators identified by the Univeristy of Illinois Chicago and how the study classified them.
| Community Area | Population | White % | Black % | Hispanic % | Median Family Income | Median Home Value | Families in poverty % |
|---|---|---|---|---|---|---|---|
| Rogers Park | 54,991 | 38 | 28 | 25 | $49,703 | $220,351 | 22 |
| West Ridge | 71,942 | 43 | 11 | 21 | $54,038 | $242,582 | 16 |
| Uptown | 56,362 | 52 | 21 | 13 | $65,233 | $267,103 | 18 |
| Lincoln Square | 39,493 | 63 | 5 | 19 | $71,257 | $343,443 | 8 |
| North Center | 31,867 | 79 | 2 | 13 | $120,473 | $481,266 | 2 |
| Lake View | 94,368 | 80 | 4 | 8 | $130,070 | $380,237 | 4 |
| Lincoln Park | 64,116 | 82 | 4 | 7 | $170,804 | $497,626 | 4 |
| Near North Side | 80,484 | 72 | 10 | 6 | $134,512 | $436,866 | 8 |
| Edison Park | 11,341 | 92 | 0 | 4 | $91,480 | $331,448 | 1 |
| Norwood Park | 36,742 | 80 | 1 | 13 | $81,073 | $299,298 | 4 |
| Jefferson Park | 25,448 | 68 | 1 | 20 | $74,367 | $277,326 | 5 |
| Forest Glen | 18,508 | 72 | 2 | 13 | $113,950 | $411,792 | 5 |
| North Park | 17,931 | 50 | 2 | 18 | $67,394 | $318,305 | 9 |
| Albany Park | 51,542 | 29 | 4 | 52 | $50,001 | $263,755 | 17 |
| Portage Park | 64,124 | 51 | 1 | 42 | $62,703 | $265,946 | 11 |
| Irving Park | 53,359 | 43 | 3 | 45 | $59,526 | $301,946 | 11 |
| Dunning | 41,932 | 71 | 1 | 23 | $69,748 | $246,797 | 7 |
| Montclare | 13,426 | 38 | 5 | 52 | $52,336 | $225,746 | 12 |
| Belmont Cragin | 78,743 | 15 | 5 | 77 | $44,088 | $227,287 | 19 |
| Hermosa | 25,010 | 8 | 1 | 90 | $42,506 | $255,690 | 18 |
| Avondale | 39,262 | 26 | 4 | 65 | $49,353 | $291,611 | 14 |
| Logan Square | 73,595 | 42 | 7 | 48 | $63,098 | $371,081 | 18 |
| Humboldt Park | 56,323 | 6 | 44 | 51 | $31,459 | $199,025 | 32 |
| West Town | 81,432 | 57 | 9 | 29 | $85,688 | $390,875 | 14 |
| Austin | 98,514 | 4 | 86 | 9 | $37,468 | $201,640 | 26 |
| West Garfield Park | 18,001 | 1 | 97 | 1 | $24,852 | $186,516 | 42 |
| East Garfield Park | 20,567 | 3 | 94 | 2 | $26,748 | $206,460 | 42 |
| Near West Side | 54,881 | 42 | 33 | 9 | $89,844 | $319,232 | 15 |
| North Lawndale | 35,912 | 2 | 92 | 5 | $25,661 | $169,863 | 42 |
| South Lawndale | 79,288 | 4 | 11 | 84 | $31,078 | $166,349 | 31 |
| Lower West Side | 35,769 | 12 | 3 | 82 | $37,243 | $244,349 | 25 |
| Loop | 29,283 | 63 | 12 | 6 | $134,496 | $346,023 | 5 |
| Near South Side | 21,390 | 45 | 28 | 6 | $112,630 | $354,604 | 8 |
| Armour Square | 13,391 | 11 | 12 | 5 | $30,444 | $238,249 | 34 |
| Douglas | 18,238 | 12 | 72 | 3 | $50,794 | $257,226 | 25 |
| Oakland | 5,918 | 3 | 93 | 4 | $33,379 | $216,478 | 39 |
| Fuller Park | 2,876 | 2 | 92 | 5 | $29,795 | $111,318 | 31 |
| Grand Boulevard | 21,929 | 4 | 92 | 3 | $40,128 | $235,916 | 28 |
| Kenwood | 17,841 | 17 | 71 | 4 | $63,287 | $291,725 | 19 |
| Washington Park | 11,717 | 0 | 98 | 1 | $24,561 | $171,548 | 44 |
| Hyde Park | 25,681 | 47 | 34 | 6 | $81,920 | $257,957 | 11 |
| Woodlawn | 25,983 | 7 | 88 | 2 | $35,568 | $188,697 | 27 |
| South Shore | 49,767 | 2 | 95 | 1 | $38,815 | $172,485 | 25 |
| Chatham | 31,028 | 0 | 98 | 0 | $38,665 | $151,220 | 25 |
| Avalon Park | 10,185 | 2 | 97 | 0 | $50,642 | $163,689 | 16 |
| South Chicago | 31,198 | 3 | 73 | 24 | $38,809 | $132,964 | 28 |
| Burnside | 2,916 | 1 | 99 | 0 | $29,412 | $125,685 | 33 |
| Calumet Heights | 13,812 | 1 | 95 | 4 | $58,482 | $167,332 | 10 |
| Roseland | 44,619 | 1 | 97 | 1 | $42,514 | $133,495 | 19 |
| Pullman | 7,325 | 7 | 85 | 8 | $41,910 | $124,839 | 24 |
| South Deering | 15,109 | 5 | 62 | 32 | $36,774 | $112,843 | 29 |
| East Side | 23,042 | 17 | 3 | 79 | $46,096 | $134,193 | 22 |
| West Pullman | 33,227 | 2 | 94 | 4 | $42,199 | $122,992 | 24 |
| Riverdale | 6,482 | 0 | 98 | 2 | $17,292 | $85,407 | 55 |
| Hegewisch | 9,426 | 39 | 11 | 51 | $49,634 | $146,245 | 16 |
| Garfield Ridge | 34,513 | 53 | 7 | 39 | $72,376 | $216,747 | 6 |
| Archer Heights | 13,393 | 22 | 2 | 74 | $45,775 | $210,247 | 12 |
| Brighton Park | 45,368 | 8 | 1 | 84 | $35,805 | $183,115 | 23 |
| McKinley Park | 15,612 | 18 | 3 | 62 | $42,298 | $208,435 | 18 |
| Bridgeport | 31,977 | 33 | 2 | 29 | $53,797 | $272,612 | 17 |
| New City | 44,377 | 14 | 30 | 54 | $35,554 | $159,907 | 28 |
| West Elsdon | 18,109 | 18 | 3 | 78 | $48,719 | $183,560 | 16 |
| Gage Park | 39,894 | 5 | 5 | 90 | $37,986 | $170,517 | 22 |
| Clearing | 23,139 | 52 | 1 | 46 | $58,942 | $202,350 | 8 |
| West Lawn | 33,355 | 17 | 3 | 79 | $49,468 | $173,096 | 14 |
| Chicago Lawn | 55,628 | 4 | 54 | 42 | $37,976 | $139,427 | 26 |
| West Englewood | 35,505 | 1 | 95 | 3 | $28,677 | $106,627 | 34 |
| Englewood | 30,654 | 1 | 98 | 1 | $23,780 | $121,468 | 42 |
| Greater Grand Crossing | 32,602 | 1 | 97 | 1 | $32,451 | $143,811 | 31 |
| Ashburn | 41,081 | 17 | 52 | 31 | $69,514 | $173,183 | 10 |
| Auburn Gresham | 48,743 | 0 | 98 | 1 | $36,168 | $143,066 | 25 |
| Beverly | 20,034 | 58 | 35 | 5 | $102,579 | $297,298 | 3 |
| Washington Heights | 26,493 | 1 | 98 | 1 | $46,930 | $143,185 | 18 |
| Mount Greenwood | 19,093 | 88 | 5 | 5 | $95,357 | $237,298 | 2 |
| Morgan Park | 22,530 | 32 | 64 | 2 | $74,855 | $187,555 | 11 |
| O'Hare | 12,559 | 74 | 1 | 14 | $53,506 | $207,995 | 14 |
| Edgewater | 56,521 | 53 | 15 | 16 | $64,211 | $252,277 | 13 |